Clustering with the timeouts#
Previously we did the clustering without considering the unfinished paths due to timeouts. So we will now redo the clustering while taking them into account.
import pandas as pd
import numpy as np
import re
from pathlib import Path
# dimensionality reduction
from sklearn.decomposition import PCA
from umap import umap_ as UMAP
# plotting
import seaborn as sns
import matplotlib.pyplot as plt
import plotly.express as px
import plotly.offline as pyo
pyo.init_notebook_mode()
# clustering
from leiden_clustering import LeidenClustering
import utils
DATA_PATH = Path.cwd() / "../data"
FIG_PATH = Path.cwd() / "../src"
FILTER_TIMEOUT = False
if FILTER_TIMEOUT:
FIG_PATH = FIG_PATH / "figures/leiden/"
else:
FIG_PATH = FIG_PATH / "figures/leiden_with_timeout/"
FIG_PATH = FIG_PATH.resolve()
print(f"Figure path: {FIG_PATH}")
data = {
Path(f).stem: pd.read_csv(f, index_col=0) for f in DATA_PATH.glob("combined_*.csv")
}
print(list(data.keys()))
if not FIG_PATH.exists():
FIG_PATH.mkdir(parents=True)
Figure path: C:\Users\Cyril\Desktop\Code\ada-2023-project-adamants\src\figures\leiden_with_timeout
['combined_metrics_finished_edges', 'combined_metrics_finished_paths', 'combined_metrics_unfinished_edges', 'combined_metrics_unfinished_paths']
features_finished_paths = data["combined_metrics_finished_paths"].reset_index(drop=True)
features_unfinished_paths = data["combined_metrics_unfinished_paths"].reset_index(
drop=True
)
combined_df = pd.concat([features_finished_paths, features_unfinished_paths], axis=0)
combined_df["finished"] = [1] * len(features_finished_paths) + [0] * len(
features_unfinished_paths
)
combined_df[utils.FEATURES_COLS_USED_FOR_CLUSTERING] = utils.normalize_features(
combined_df[utils.FEATURES_COLS_USED_FOR_CLUSTERING]
)
combined_df.dropna(subset=utils.FEATURES_COLS_USED_FOR_CLUSTERING, inplace=True)
X = combined_df[utils.FEATURES_COLS_USED_FOR_CLUSTERING].copy().values
#fix seed for reproducibility
np.random.seed(2)
clustering = LeidenClustering(
leiden_kws={"n_iterations": -1, "seed": 0, "resolution_parameter": 0.2},
pca_kws={"n_components": 7},
)
clustering.fit(X)
clustering.labels_
c:\Users\Cyril\anaconda3\envs\DLbiomed\lib\site-packages\pynndescent\pynndescent_.py:346: NumbaPendingDeprecationWarning:
Code using Numba extension API maybe depending on 'old_style' error-capturing, which is deprecated and will be replaced by 'new_style' in a future release. See details at https://numba.readthedocs.io/en/latest/reference/deprecation.html#deprecation-of-old-style-numba-captured-errors
Exception origin:
File "c:\Users\Cyril\anaconda3\envs\DLbiomed\lib\site-packages\numba\core\types\functions.py", line 486, in __getnewargs__
raise ReferenceError("underlying object has vanished")
c:\Users\Cyril\anaconda3\envs\DLbiomed\lib\site-packages\pynndescent\pynndescent_.py:348: NumbaPendingDeprecationWarning:
Code using Numba extension API maybe depending on 'old_style' error-capturing, which is deprecated and will be replaced by 'new_style' in a future release. See details at https://numba.readthedocs.io/en/latest/reference/deprecation.html#deprecation-of-old-style-numba-captured-errors
Exception origin:
File "c:\Users\Cyril\anaconda3\envs\DLbiomed\lib\site-packages\numba\core\types\functions.py", line 486, in __getnewargs__
raise ReferenceError("underlying object has vanished")
c:\Users\Cyril\anaconda3\envs\DLbiomed\lib\site-packages\pynndescent\pynndescent_.py:358: NumbaPendingDeprecationWarning:
Code using Numba extension API maybe depending on 'old_style' error-capturing, which is deprecated and will be replaced by 'new_style' in a future release. See details at https://numba.readthedocs.io/en/latest/reference/deprecation.html#deprecation-of-old-style-numba-captured-errors
Exception origin:
File "c:\Users\Cyril\anaconda3\envs\DLbiomed\lib\site-packages\numba\core\types\functions.py", line 486, in __getnewargs__
raise ReferenceError("underlying object has vanished")
array([0, 5, 0, ..., 3, 3, 4])
# UMAP
umap = UMAP.UMAP(n_components=3, metric="euclidean")
result_umap_euc = umap.fit_transform(X)
c:\Users\Cyril\anaconda3\envs\DLbiomed\lib\site-packages\pynndescent\pynndescent_.py:346: NumbaPendingDeprecationWarning:
Code using Numba extension API maybe depending on 'old_style' error-capturing, which is deprecated and will be replaced by 'new_style' in a future release. See details at https://numba.readthedocs.io/en/latest/reference/deprecation.html#deprecation-of-old-style-numba-captured-errors
Exception origin:
File "c:\Users\Cyril\anaconda3\envs\DLbiomed\lib\site-packages\numba\core\types\functions.py", line 486, in __getnewargs__
raise ReferenceError("underlying object has vanished")
c:\Users\Cyril\anaconda3\envs\DLbiomed\lib\site-packages\pynndescent\pynndescent_.py:348: NumbaPendingDeprecationWarning:
Code using Numba extension API maybe depending on 'old_style' error-capturing, which is deprecated and will be replaced by 'new_style' in a future release. See details at https://numba.readthedocs.io/en/latest/reference/deprecation.html#deprecation-of-old-style-numba-captured-errors
Exception origin:
File "c:\Users\Cyril\anaconda3\envs\DLbiomed\lib\site-packages\numba\core\types\functions.py", line 486, in __getnewargs__
raise ReferenceError("underlying object has vanished")
c:\Users\Cyril\anaconda3\envs\DLbiomed\lib\site-packages\pynndescent\pynndescent_.py:358: NumbaPendingDeprecationWarning:
Code using Numba extension API maybe depending on 'old_style' error-capturing, which is deprecated and will be replaced by 'new_style' in a future release. See details at https://numba.readthedocs.io/en/latest/reference/deprecation.html#deprecation-of-old-style-numba-captured-errors
Exception origin:
File "c:\Users\Cyril\anaconda3\envs\DLbiomed\lib\site-packages\numba\core\types\functions.py", line 486, in __getnewargs__
raise ReferenceError("underlying object has vanished")
UMAP plot of the Leiden clustering#
fig = px.scatter_3d(
result_umap_euc,
x=0,
y=1,
z=2,
color=clustering.labels_.astype(str),
category_orders={"color": [str(i) for i in range(0, len(np.unique(clustering.labels_)))]},
title="UMAP, clustering by leiden algorithm",
# reduce size points
size_max=0.1,
)
fig.update_layout({"plot_bgcolor": "#14181e", "paper_bgcolor": "#14181e"})
fig.update_layout(font_color="white")
fig.update_layout(scene=dict(xaxis=dict(showticklabels=False), yaxis=dict(showticklabels=False), zaxis=dict(showticklabels=False)))
fig.update_layout(legend_title_text="Cluster")
fig.update_layout(legend = dict(bgcolor = 'rgba(0,0,0,0)'))
fig.update_layout(scene=dict(xaxis_title="UMAP 1", yaxis_title="UMAP 2", zaxis_title="UMAP 3"))
fig.update_layout(scene = dict(
xaxis = dict(
backgroundcolor="rgba(0, 0, 0,0)",
# gridcolor="rgba(0, 0, 0,0)", # gridcolor is for logo
showbackground=True,
zerolinecolor="white",),
yaxis = dict(
backgroundcolor="rgba(0, 0, 0,0)",
# gridcolor="rgba(0, 0, 0,0)",
showbackground=True,
zerolinecolor="white"),
zaxis = dict(
backgroundcolor="rgba(0, 0, 0,0)",
# gridcolor="rgba(0, 0, 0,0)",
showbackground=True,
zerolinecolor="white",),),
)
display(fig)
We see that when considering timeouts, a new cluster adds itself ! Now we need to check the distribution of the features to see if this new cluster is related to the timeouts.
Features distributions across clusters#
feat_labels = utils.get_feature_names_labels()
# plot histogram features colored by cluster
with plt.style.context("dark_background"):
plot_data = combined_df[utils.FEATURES_COLS_USED_FOR_CLUSTERING].copy().dropna()
plot_data["cluster"] = clustering.labels_
plot_data["cluster"] = plot_data["cluster"].astype("category")
n_features = len(plot_data.columns) - 1
n_cols = 3
n_rows = int(np.ceil(n_features / n_cols))
fig, axs = plt.subplots(n_rows, n_cols, figsize=(20, 20))
axs = axs.flatten()
for i, col in enumerate(plot_data.columns):
if col == "cluster":
continue
sns.histplot(
data=plot_data,
x=col,
hue="cluster",
ax=axs[i],
stat="density",
common_norm=False,
palette="tab10",
)
utils.set_axis_style(axs, i)
plt.suptitle("Histograms of normalized features colored by cluster", fontsize=20)
plt.subplots_adjust(top=0.95)
plt.show()
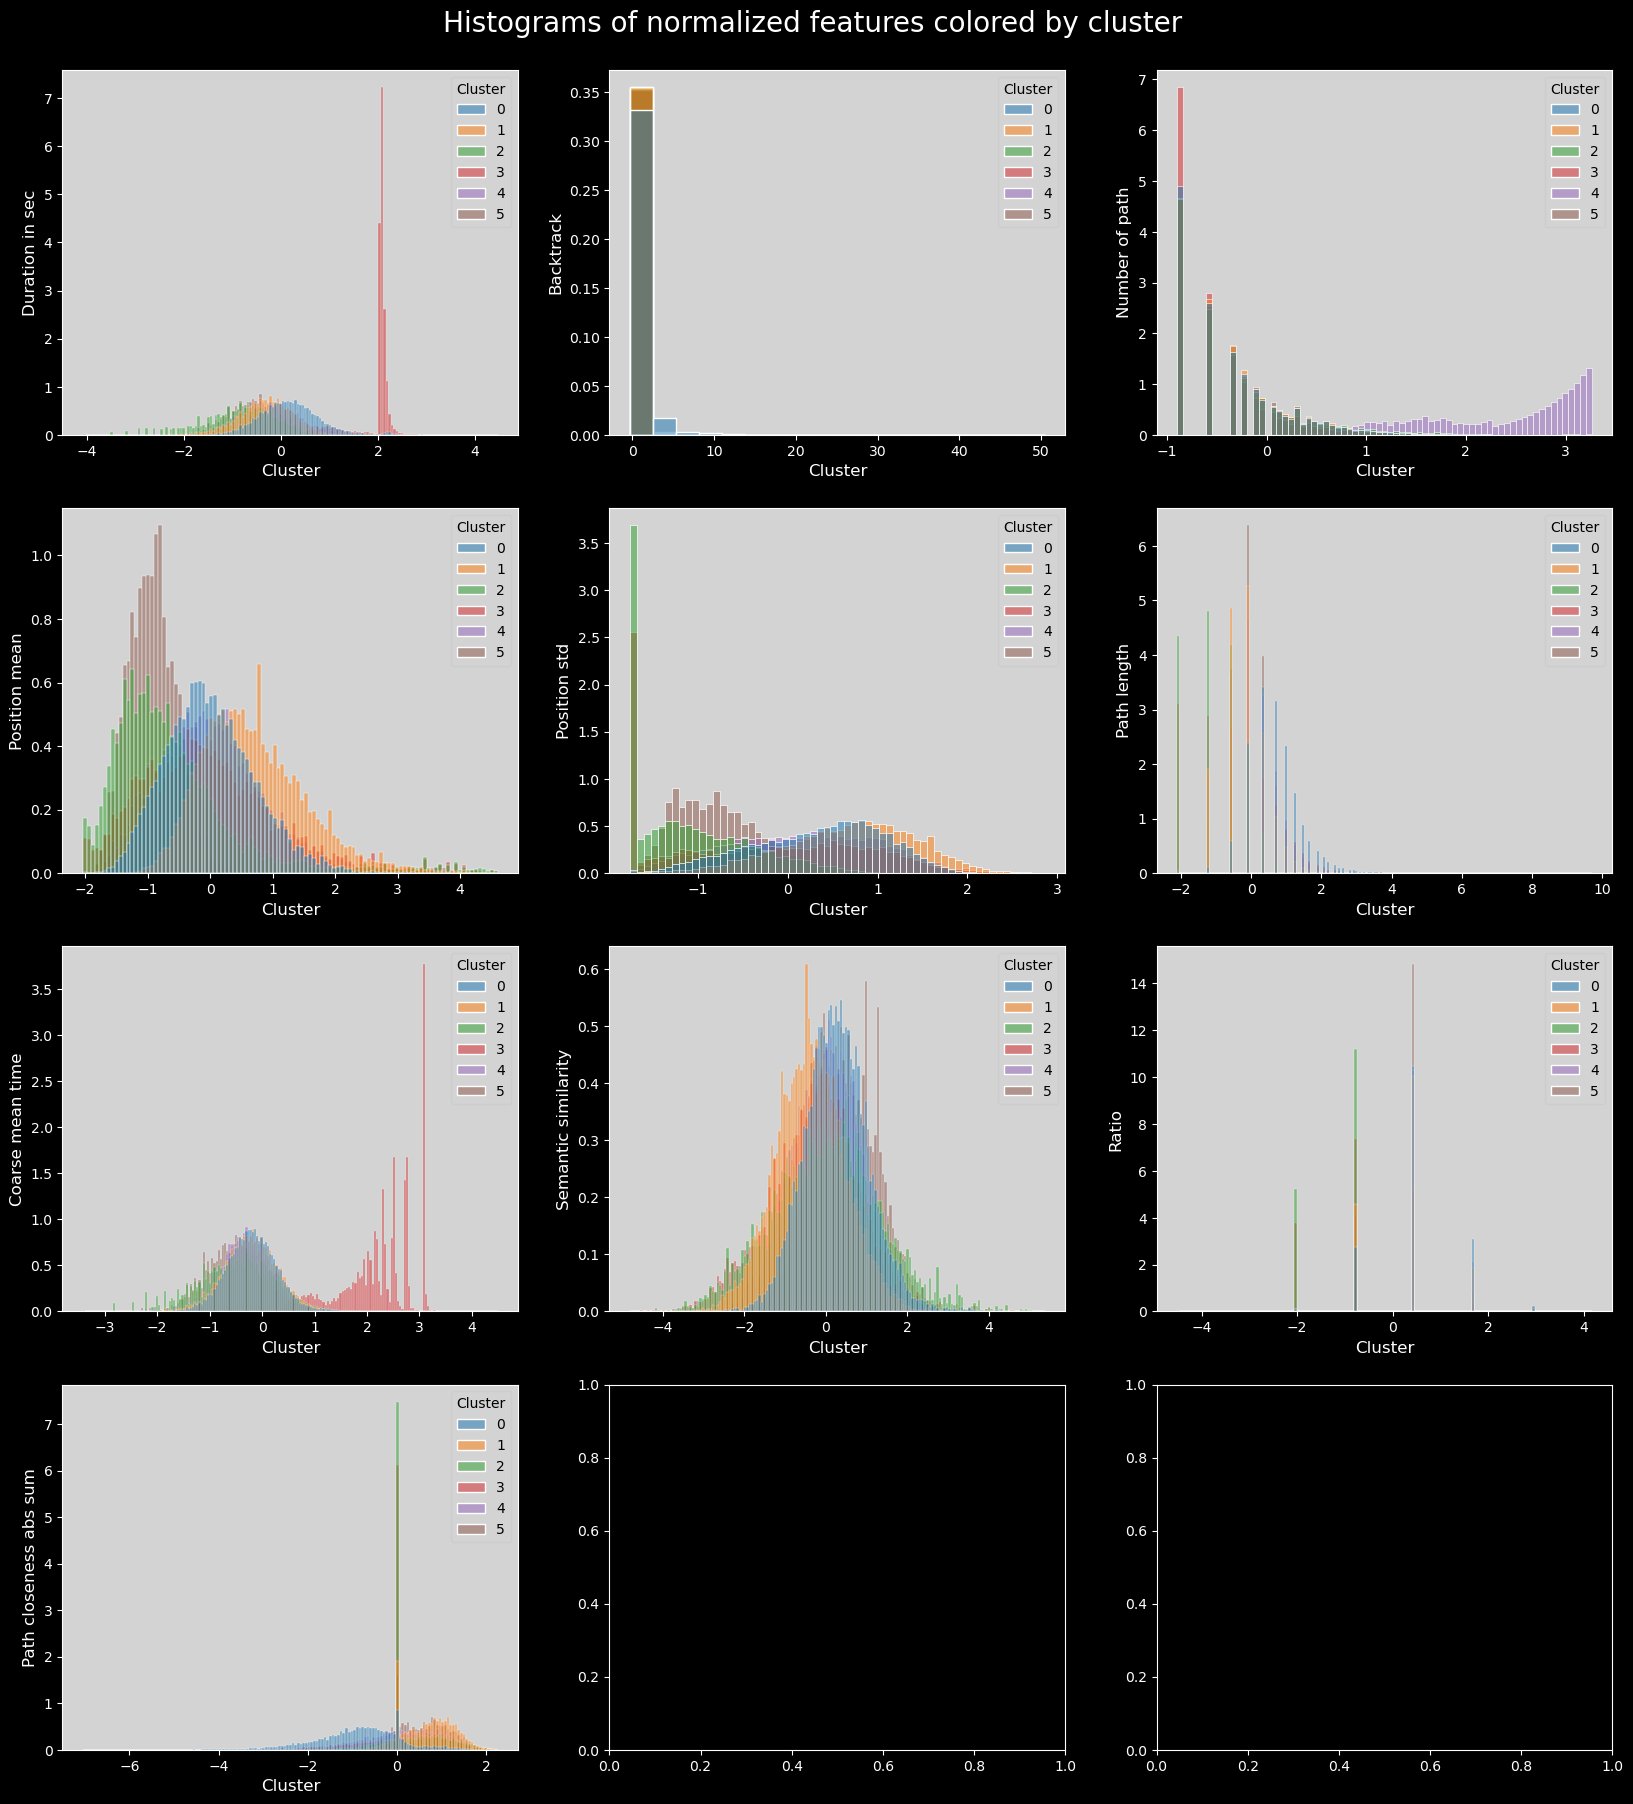
As is visible in the durationinSec plot, the third cluster (in red) concentrates all the longest times taken; this is also visible in coarse_mean_time.
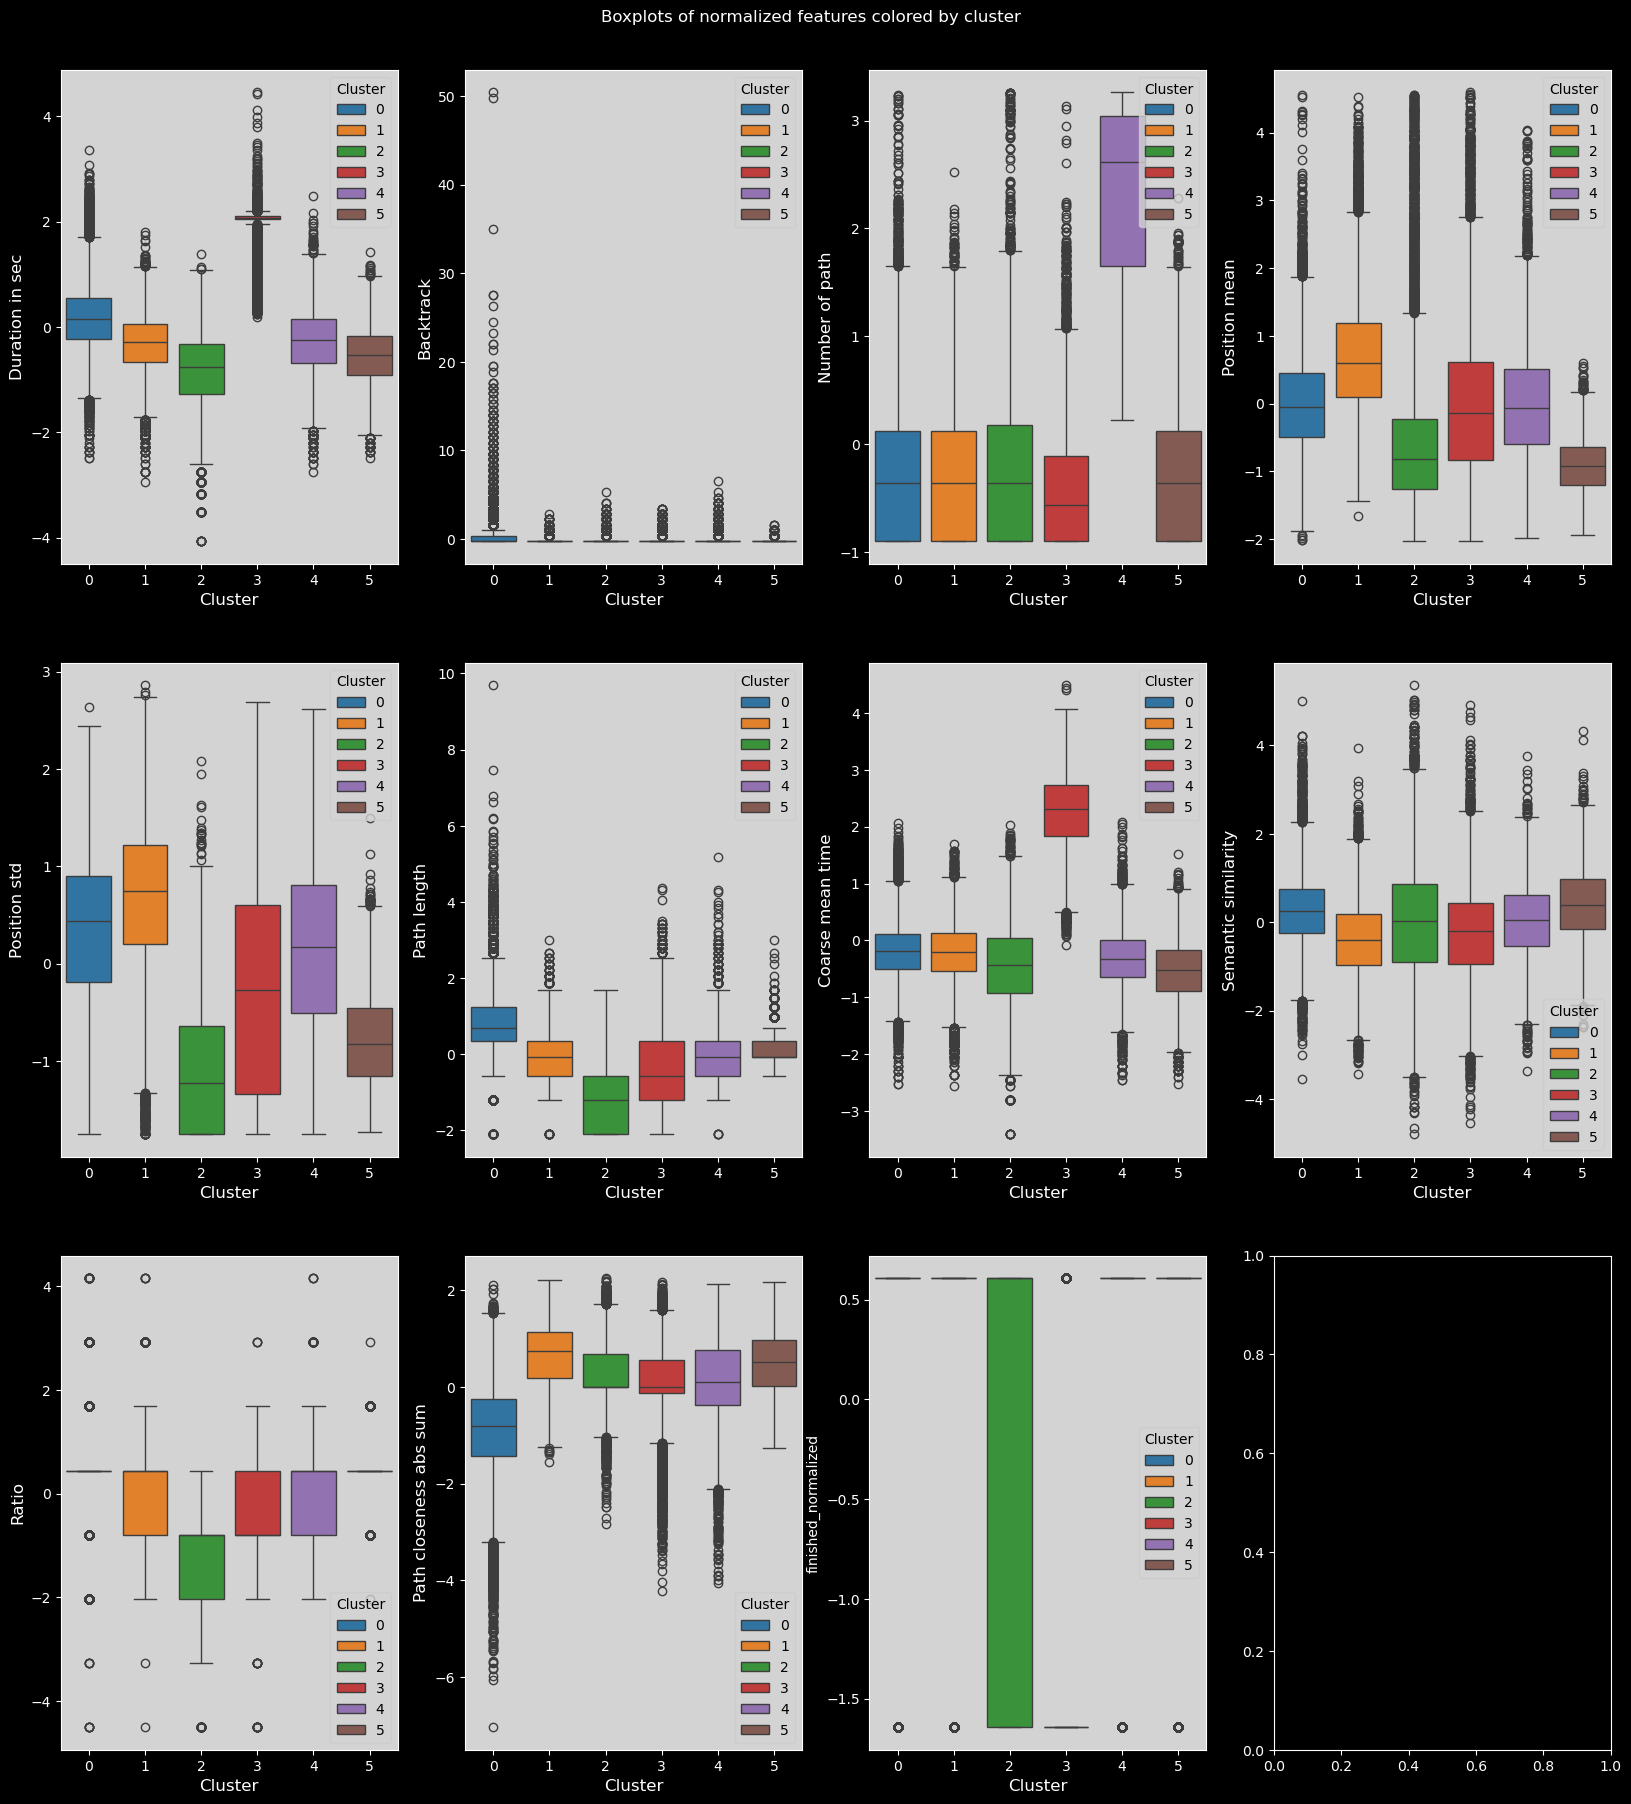
# plot the boxplots of features colored by cluster
with plt.style.context("dark_background"):
combined_df["finished_normalized"] = (
combined_df["finished"] - combined_df["finished"].mean()
) / combined_df["finished"].std()
plot_data = combined_df[utils.FEATURES_COLS_USED_FOR_CLUSTERING + ["finished_normalized"]].copy()
plot_data["cluster"] = clustering.labels_
plot_data["cluster"] = plot_data["cluster"].astype("category")
n_features = len(plot_data.columns) - 1
n_cols = 4
n_rows = int(np.ceil(n_features / n_cols))
fig, axs = plt.subplots(n_rows, n_cols, figsize=(20, 20))
fig.suptitle("Boxplots of normalized features colored by cluster")
plt.subplots_adjust(top=0.95)
axs = axs.flatten()
for i, col in enumerate(plot_data.columns):
if col == "cluster":
continue
sns.boxplot(data=plot_data, x="cluster", y=col, ax=axs[i], hue="cluster", palette="tab10")
utils.set_axis_style(axs, i)
plt.show()
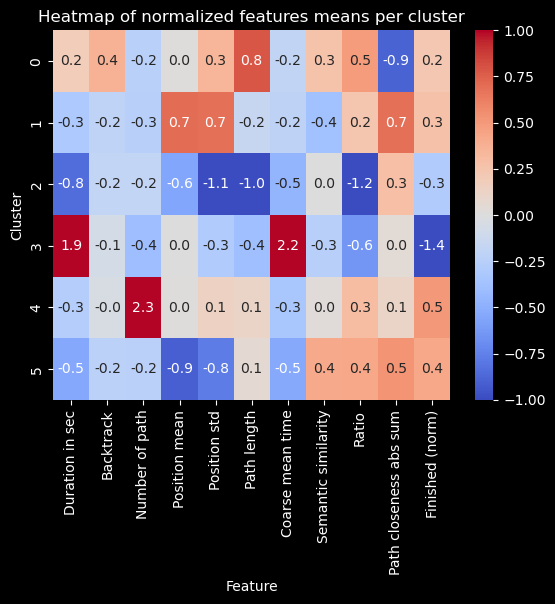
Heatmap of feature means for each cluster#
# heatmap of features means per cluster
with plt.style.context("dark_background"):
means = plot_data.groupby(plot_data["cluster"]).mean()
sns.heatmap(means, cmap="coolwarm", annot=True, fmt=".1f", vmin=-1, vmax=1)
plt.title("Heatmap of normalized features means per cluster")
plt.ylabel("Cluster")
plt.xlabel("Feature")
plt.xticks(labels=feat_labels+["Finished (norm)"], ticks=np.arange(len(feat_labels)+1)+0.5, rotation=90)
plt.show()
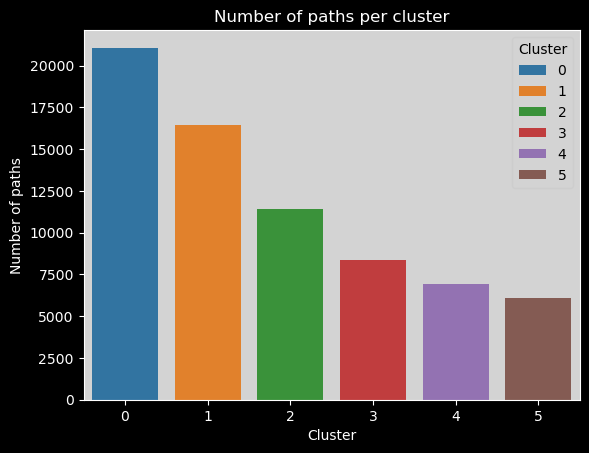
Number of paths per cluster#
clusters_names,n_points = np.unique(plot_data["cluster"], return_counts=True)
with plt.style.context("dark_background"):
sns.barplot(x=clusters_names, y=n_points,hue=range(len(clusters_names)), palette="tab10").set_title("Number of paths per cluster")
# make background grey
plt.gca().patch.set_facecolor("#d3d3d3")
# update legend style
leg = plt.gca().get_legend()
leg.get_frame().set_facecolor("#d3d3d3")
leg.set_title("Cluster")
leg_title = leg.get_title()
leg_title.set_color("black")
# change all legend text to black
[text.set_color("black") for text in leg.get_texts()]
plt.xlabel("Cluster")
plt.ylabel("Number of paths")
plt.show()
Number of timeouts per cluster#
if not FILTER_TIMEOUT:
# number of timeouts per cluster
with plt.style.context("dark_background"):
plot_data["timeout"] = combined_df["type"] == "timeout"
timeout_per_cluster = plot_data.groupby(plot_data["cluster"])["timeout"].sum()
sns.barplot(x=clusters_names,
y=timeout_per_cluster,
hue=range(len(clusters_names)),
palette="tab10",
).set_title(
"Number of timeouts per cluster"
)
plt.gca().patch.set_facecolor("#d3d3d3")
leg = plt.gca().get_legend()
leg.get_frame().set_facecolor("#d3d3d3")
leg.set_title("Cluster")
leg_title = leg.get_title()
leg_title.set_color("black")
[text.set_color("black") for text in leg.get_texts()]
plt.xlabel("Cluster")
plt.ylabel("Number of timeouts")
plt.show()
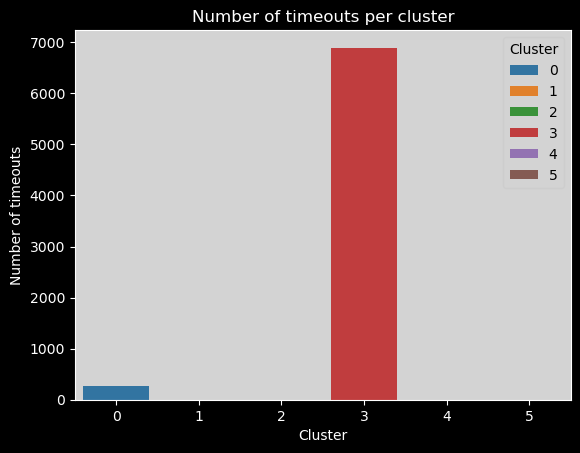
Again, we can here see that most timeouts are in the third cluster.